Deconstructing Deprivation: Analyzing Cluster ID 159 in Lahore’s Poverty Landscape May 15, 2023 – Posted in: clusters
Comparison of the Deprivation between Slums and Demographic Health Survey Clusters in Lahore, Pakistan
This blog and the research findings here have been possible because of financial support received by the Google Research Scholar Award for the work on “Is Economics from Afar Domain Generalizable?”
Introduction
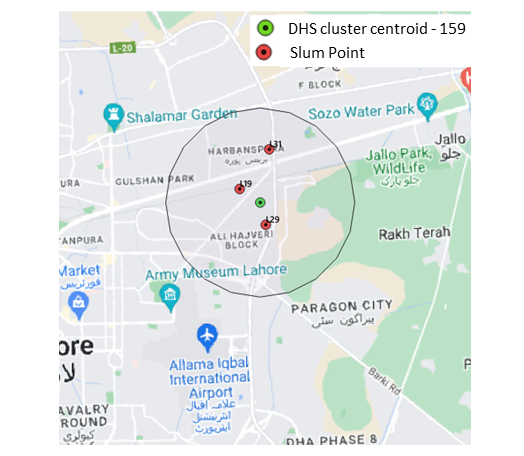
Our third blog in the series, “Comparison of the Deprivation between Slums and Demographic Health Survey Clusters in Lahore, Pakistan,” takes into account Cluster-ID HV001-159. The three slums encompassed in the 4 km radius of the Cluster ID HV001-156 are L31 (QalandarPura-II(Wahga Town), L19 (Manzoor Colony (Wahga Town) and L29 (Peer Nasir Colony) Figure 1 maps the location of the DHS Cluster HV001 159 with a 4 km buffer drawn around its center point. For easier visual comparison, the three slums that the buffer encompasses are also mapped at their respective locations.
For these slums, we randomly selected 12, 23 and 30 households for our survey. Table 1 lists the sample slums and households for this analysis.

Figure 1 Visual representation of Cluster-ID – HV001- 159 with a 4km buffer. The 6 slums encompassed in the buffer are also marked.
| ID Slums | Slums in Lahore | No. of Sample Households |
| L31 | (Qalandar Pura-II(Wahga Town | 12 |
| L19 | Manzoor Colony (Wahga Town | 23 |
| L29 | Peer Nasir Colony | 30 |
Table 1 No. Of Sampled Households in Selected Slums in Lahore
Analysis
In this section, we present our estimated MPI scores, which reflect the proportion of weighted deprivations that the poor experience in a society out of all the total potential deprivations that the society could experience. For a detailed methodology of how to measure MPI, please refer to Blog 1 of our series
This means that multidimensionally poor people in HV001–159 experience 4.3 percent of the total deprivations that would be experienced if all people were deprived in all indicators. Similarly, slums L31 (QalandarPura-II(Wahga Town), L19 (Manzoor Colony (Wahga Town) and L29 (Peer Nasir Colony) are deprived of 3.5%, 16.2% and 19.2% of the potential deprivations they can experience.
Given that the cutoff is 33.33%, the cluster and neither the slums can be categorized as multidimensionally poor. The disaggregated findings are presented in Table 2 below. For a visual representation, refer to Figure 2.
| Dimensions | DHS Cluster ID-159 | L31 | L19 | L29 | Slums Average |
| MPI | 0.043 | 0.035 | 0.162 | 0.192 | 0.129 |
| Education | 0.447 | 0.802 | 0.182 | 0.64 | 0.541 |
| Health | 0.248 | 0 | 0.213 | 0.173 | 0.128 |
| Living Standards | 0.304 | 0.198 | 0.605 | 0.176 | 0.326 |
Table 2 Multidimensional Poverty Index (MPI) of DHS Cluster (HV001-159) and Slums located inside it.
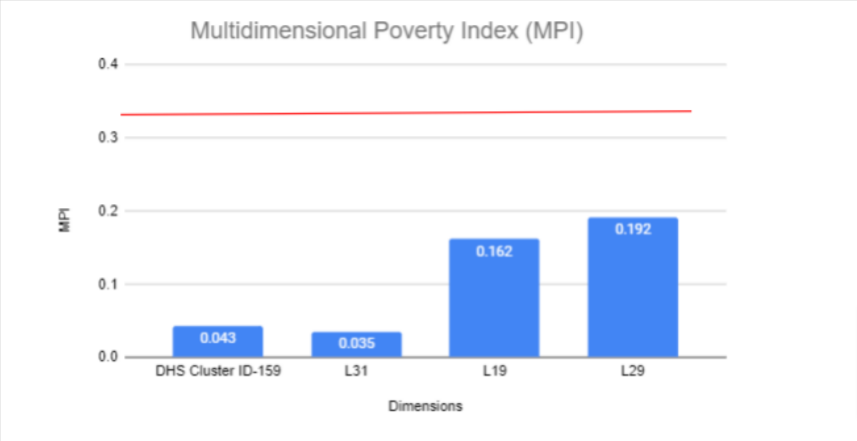
Figure 2 Multidimensional Poverty Index (MPI) of DHS Cluster (HV001-159) and Slums located inside it.
For HV001- 159, the highest deprivation can be seen in the dimension of education 44,7%), followed by Living standards (30.4%) and health (24.8%).
Comparatively, for Slum L31 the highest deprivation can be seen in the dimension of education (80.2%), followed by Living standards (19.8%) and no deprivation in health.
Slum L19 records the highest deprivation in the dimension of Living standards (60.5%) followed by health (21.3%) and education (18.2%),
Lastly, slum L29 is most deprived in the dimension of Living Standards (17.6%) followed by Health (17.3%) and Education (6.4%).
Overall, the slums in DHS Cluster-ID 159 faced the most deprivation in Education (an average of 54.1%), followed by Living Standards (an average of 32.6%) and Health (an average of 12.8%). Refer to Figure 3.
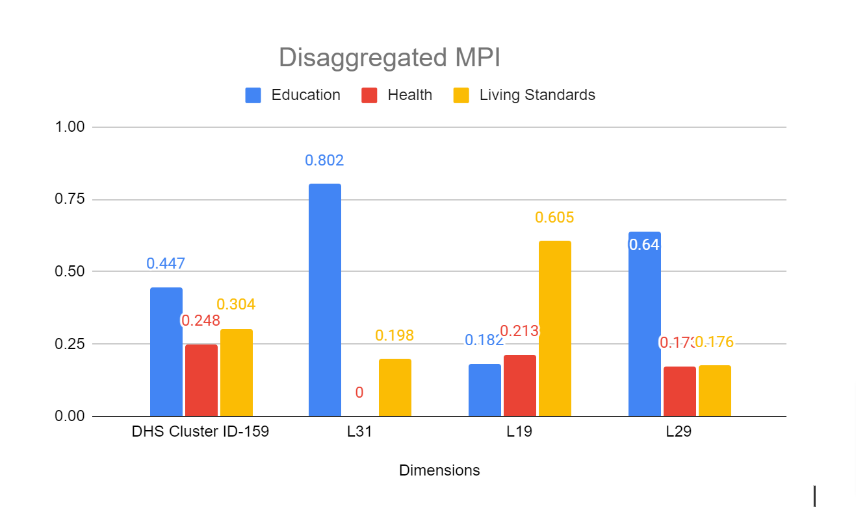
Figure 3 Disaggregated MPI.
Conclusion
The MPI methodology shows aspects in which the poor are deprived and helps to reveal the interconnections among those deprivations. This enables policymakers to target resources and design policies more effectively. This is especially useful where the MPI reveals areas or groups characterized by severe deprivation.
Our blog provides a brief comparison of the levels of deprivation in slums and the DHS Cluster. Our framework can assist in identifying which specific geographical region and aspects of deprivation contribute the most to Lahore’s overall poverty level. As can be seen in this blog, some policy solutions to consider to improve/reduce multidimensional poverty would be to improve access to healthcare.
There are two sides to the access problem. On the supply side, good quality, effective health care may not be offered. On the demand side, individuals may not utilize services from which they could benefit.
Access to health care can be defined in a variety of ways. In its most narrow sense, it refers to geographic availability. A far broader definition identifies four dimensions of access: availability, accessibility, affordability, and acceptability. Public authorities should focus on each of these constraints to alleviate the issue.
Community financing, micro-credit schemes, entitlement cards, and conditional cash transfers have all been demonstrated to raise health care utilization. But their application is still very limited, both geographically and with respect to the services. Implementation should be accompanied by evaluation so the design of a scheme can be modified to improve effectiveness. Second, the evaluation provides lessons for implementation elsewhere.
Moreover, the Government need not administer targeting schemes. Responsibility can be given to the community and NGOs.Concerning the health system, positive results of NGO-government collaboration include improvements of the health indicators in communities, increased financial resources of the health sector, and strengthening local governments’ capacities to provide health-care services.
Findings from studies like ours can help zero in on specific areas of the world where inequality is a problem, allowing us to develop location-specific remedies as opposed to applying a universal panacea.