Penetrating the Poverty Web: An Exclusive Look at Cluster ID 158 in Lahore May 15, 2023 – Posted in: clusters
Comparison of the Deprivation between Slums and Demographic Health Survey Clusters in Lahore, Pakistan
This blog and the research findings here have been possible because of financial support received by the Google Research Scholar Award for the work on “Is Economics from Afar Domain Generalizable?”
Introduction
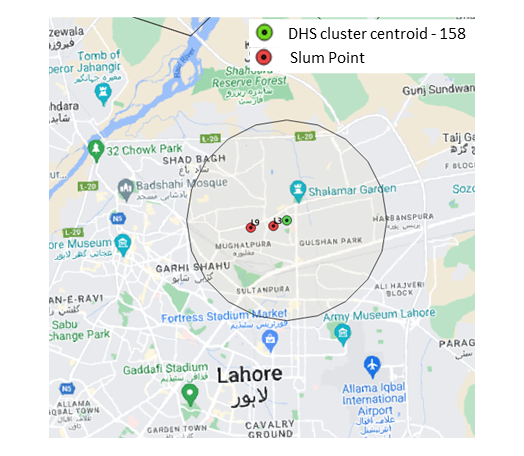
Our fourth blog in the series, “Comparison of the Deprivation between Slums and Demographic Health Survey Clusters in Lahore, Pakistan,” takes into account Cluster-ID HV001-158. The two slums encompassed in the 4 km radius of the Cluster ID HV001-158 are L9 (Begum Pura/Mehmood Abad) and L3 (Ahata Baba Beri Wala No.1). Figure 1 maps the location of the DHS Cluster HV001 158 with a 4 km buffer drawn around its center point. For easier visual comparison, the two slums that the buffer encompasses are also mapped at their respective locations.
For these slums, we randomly selected 8 and 10 households for our survey. Table 1 lists the sample slums and households for this analysis.

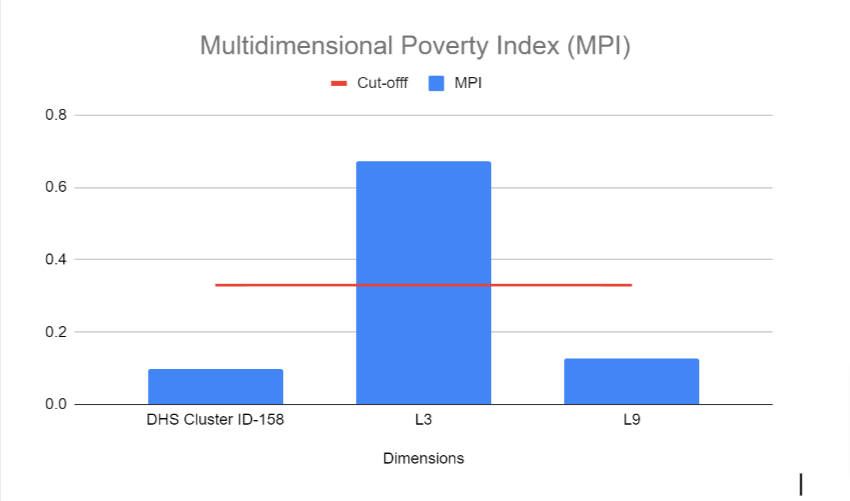
Figure 1 Visual representation of Cluster-ID – HV001- 158 with a 4km buffer. The 6 slums encompassed in the buffer are also marked.
| ID Slums | Slums in Lahore | No. of Sample Households |
| L3 | Ahata Baba Beri Wala No.1 | 8 |
| L9 | Begum Pura/Mehmood Abad | 10 |
Table 1 No. Of Sampled Households in Selected Slums in Lahore
Analysis
In this section, we present our estimated MPI scores, which reflect the proportion of weighted deprivations that the poor experience in a society out of all the total potential deprivations that the society could experience. For a detailed methodology of how to measure MPI, please refer to this blog.
This means that multidimensionally poor people in HV001–158 experience 9.7 percent of the total deprivations that would be experienced if all people were deprived in all indicators. Similarly, slums L3 and L9 are deprived in 67.3% and 12.8% of the potential deprivations they can experience.
Since 33.33% is the cutoff, the cluster cannot be called multidimensionally poor. However, one of the two slums can be. The disaggregated findings are presented in Table 2 below. For a visual representation, refer to Figure 2.
| Dimensions | DHS Cluster ID-158 | L3 | L9 | Slums Average |
| MPI | 0.097 | 0.673 | 0.128 | 0.4005 |
| Education | 0.574 | 0.499 | 0.35 | 0.4245 |
| Health | 0.213 | 0.108 | 0.389 | 0.2485 |
| Living Standards | 0.213 | 0.394 | 0.26 | 0.3270 |
Table 2 Multidimensional Poverty Index (MPI) of DHS Cluster (HV001-158) and Slums located inside it.
Figure 2 Multidimensional Poverty Index (MPI) of DHS Cluster (HV001-158) and six Slums located inside it. The red line indicates the cut-off value of 0.3333.
For the cluster HV001- 158, the highest deprivation can be seen in the dimension of education (57.4%), followed by equal deprivation in Living standards (21.3%) and health (21.3%).
Comparatively, for Slum L3 the highest deprivation can be seen in the dimension of education (49.9%), followed by Living standards (39.4%) and health (10.8%).
Slum L9 records the highest deprivation in the dimension of Health (38.9%), followed by education (3.5%) and Living standards (2.6%)
Refer to Figure 3. for a visual representation of the disaggregated MPI.
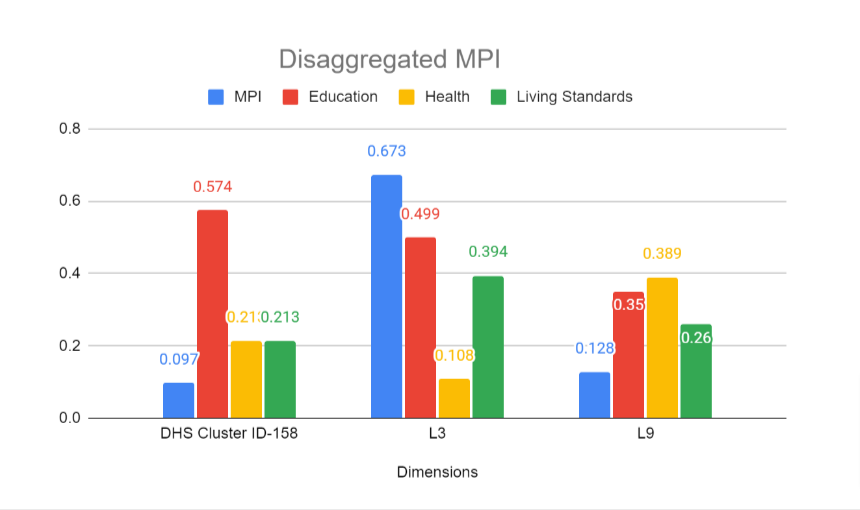
Figure 3 Disaggregated MPI.
Conclusion
For this sort of research to be translated into even more effective policymaking, we feel there is a need for interagency cooperation. Research, like ours, results in more fine-grained information pinpointing depravity at various small geographical locations, making it possible to design targeted solutions instead of one solution for all strategies.
Machine learning and AI based solutions can help us regress or estimate such depravity from informal data-sources, avoiding costly manual surveys. Different parts of the government machinery collect vast amounts of data, and they are all viciously possessive and protective about it. If we can access existing administrative data like the location of electricity poles, BISP’s and Bait-ul-Maal’s databases, etc., it would improve the impact of our interdisciplinary research design tremendously. The consequence will be even more fine-tuned policy interventions, diminishing costs of data collection, higher rates of monitoring, and the attainment of the SDG Agenda.