Unveiling Multidimensional Poverty: An In-depth Study of Cluster ID 156 in Lahore May 5, 2023 – Posted in: clusters
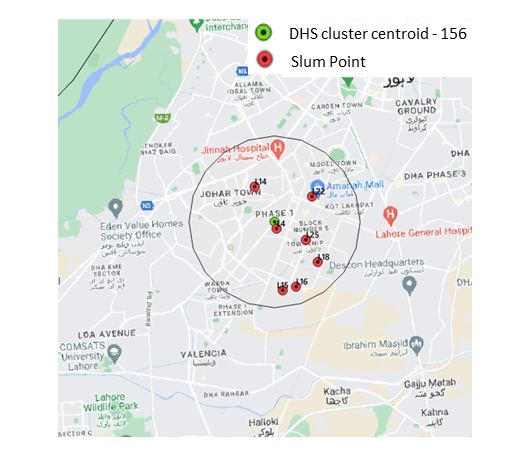
Our second blog in the series, “Comparison of the Deprivation between Slums and Demographic Health Survey Clusters in Lahore, Pakistan,” takes into account Cluster-ID HV001-156. The six slums encompassed in the 4 km radius of the Cluster ID HV001-156 are L4 (Ajodhiapur Beer), L14 (Ghafoor Abad G-Block Johar Town), L15 (Jhuggian Town), L16 (Junejo Colony No. 1, Green Town), L22 (Muhammad Pura), and L25 (Nala B-1 Township). Figure 1 maps the location of the DHS Cluster HV001 156 with a 4 km buffer drawn around its center point. For easier visual comparison, the six slums that the buffer encompasses are also mapped at their respective locations.
For these slums, we randomly selected 5, 6, 5, 5, 3 and 8 households for our survey. Table 1 lists the sample slums and households for this analysis.

Figure 1 Visual representation of Cluster-ID – HV001- 156 with a 4km buffer. The 6 slums encompassed in the buffer are also marked.
| ID Slums | Slums in Lahore | No. of Sample Households |
| L4 | Ajodhiapur Beer | 5 |
| L14 | Ghafoor Abad G-Block Johar Town | 6 |
| L15 | Jhuggian Bagrian | 5 |
| L16 | Junejo Colony No.1, Green Town | 5 |
| L22 | Muhammad Pura | 3 |
| L25 | Nala B-1 Township | 8 |
Table 1 No. Of Sampled Households in Selected Slums in Lahore
Analysis
In this section, we present our estimated MPI scores, which reflect the proportion of weighted deprivations that the poor experience in a society out of all the total potential deprivations that the society could experience. For a detailed methodology on how to measure MPI, please refer to this blog.
This means that multidimensionally poor people in HV001–156 experience 32 percent of the total deprivations that would be experienced if all people were deprived in all indicators. Similarly, slums L4, L14, L15, L16, L22, and L25 are deprived in 43.2%, 63.8%, 18.9%, 14.2%, 9.7%, and 55.5% of the potential deprivations they can experience.
Given that the cutoff is 33.33%, the cluster cannot be categorized as multidimensionally poor, but three of the six slums can. The disaggregated findings are presented in Table 2 below. For a visual representation, refer to Figure 2.
| Dimensions | DHS Cluster ID-156 | L4 | L14 | L15 | L16 | L22 | L25 | Slums Average |
| MPI | 0.320 | 0.432 | 0.638 | 0.189 | 0.142 | 0.097 | 0.555 | 0.342 |
| Education | 0.559 | 0.519 | 0.468 | 0.473 | 0.473 | 0.574 | 0.504 | 0.502 |
| Health | 0.155 | 0.038 | 0.152 | 0.351 | 0.351 | 0.213 | 0.149 | 0.209 |
| Living Standards | 0.286 | 0.443 | 0.38 | 0.176 | 0.176 | 0.213 | 0.346 | 0.344 |
Table 2 Multidimensional Poverty Index (MPI) of DHS Cluster (HV001-156) and Slums located inside it.
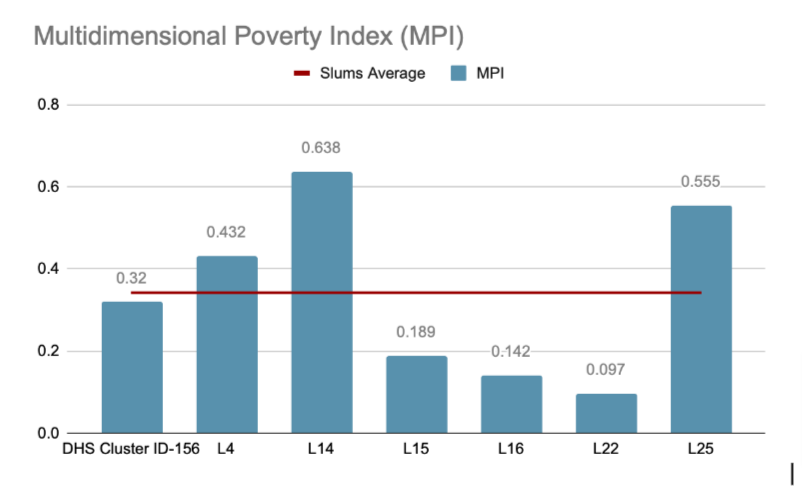 Figure 2 Multidimensional Poverty Index (MPI) of DHS Cluster (HV001-156) and six Slums located inside it. The red line indicates the cut-off value of 0.3333.
For the cluster HV001- 156, the highest deprivation can be seen in the dimension of education (55.9%), followed by Living standards (28.6%) and health (15.5%).
Comparatively, for Slum L4 the highest deprivation can be seen in the dimension of education (51.9%), followed by Living standards (44.3%) and health (3.8%).
Slum L14 records the highest deprivation in the dimension of education (46.8%), followed by health (15.2%) and Living standards (3.8%)
Slums L15 and L16 have the same estimated deprivations. They are most deprived in the dimensions of Education (47.3%) followed by Health (35.1%) and Living Standards (17.6%).
Slum L22 is most deprived in the dimension of Education (57.4%) followed by Living Standards and Health (21.3%, each).
Lastly, slum L25 is most deprived in the dimension of Education (50.4%) followed by Living Standards (34.6%) and Health (14.9%).
Overall, the slums in DHS Cluster-ID 156 faced the most deprivation in Education (an average of 50.2%), followed by Living Standards (an average of 34.4%) and Health (an average of 20.9%). Refer to Figure 3.
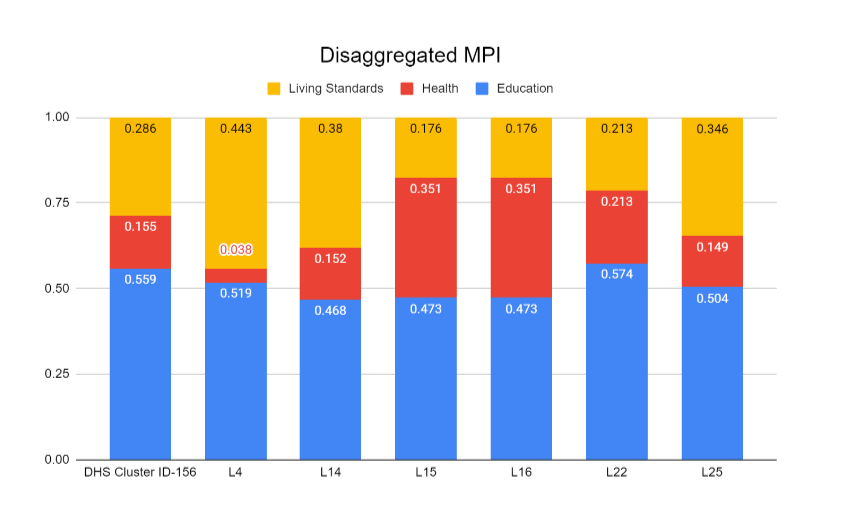 Figure 3 Disaggregated MPI.
Conclusion
The MPI methodology shows aspects in which the poor are deprived and helps to reveal the interconnections among those deprivations. This enables policymakers to target resources and design policies more effectively. This is especially useful where the MPI reveals areas or groups characterized by severe deprivation.
Our blog provides a brief comparison of the levels of deprivation in slums and the DHS Cluster. Our framework can assist in identifying which specific geographical region and aspects of deprivation contribute the most to Lahore’s overall poverty level. As can be seen in this blog, some policy solutions to consider to improve/reduce multidimensional poverty would be to improve access to education. This is helpful in the sense that while there are plenty of public schools in Lahore district, access to schools could be improved. Public authorities can consider providing school buses, which could act as an incentive for residents of this cluster. This could potentially add to the choice set of households in this cluster. Another option could be to schedule a stakeholders council meeting here and identify demand side constraints. At a more macro level, should the government consider building another school, proximity to this cluster would help identify a better solution.
Findings from studies like ours can help zero in on specific areas of the world where inequality is a problem, allowing us to develop location-specific remedies as opposed to applying a universal panacea.