Comparing Deprivation: Slums vs. Demographic Health Survey Clusters in Lahore, Pakistan May 15, 2023 – Posted in: clusters

This blog and the research findings here have been possible because of financial support received by the Google Research Scholar Award for the work on “Is Economics from Afar Domain Generalizable?

While income-based poverty represents a key factor influencing well-being and societal progress, there is a broader set of deprivations—relating to health, education and basic standards of living—that affect the lives and livelihoods of individuals and families. These directly affect people’s ability to break out of poverty.

Many countries now measure multidimensional poverty alongside income-based poverty. The former is considered a broader definition of poverty. Under this broader definition of poverty, many more people come into view as the global Multidimensional Poverty Index (MPI), a person is identified as multidimensionally poor (or MPI poor) if they have been deprived in at least one-third of the weighted MPI indicators. In other words, a person is MPI poor if their weighted deprivation score is equal to or higher than the poverty cutoff of 33.33%.

In this blog, we show the multidimensional poverty index in Lahore, Pakistan by using data from the USAID’s Demographic and Health Surveys (DHS), our work done in Sustainable Development Goals (SDG) Tech Lab in collaboration with United Nations Development Program (UNDP), United Nations Population Fund (UNFPA) and Intelligent Machines Lab which is supported by the Google ResearchScholarAward.

Our findings present the extent of deprivation that exists not only in one of the 13 clusters identified by DHS in Lahore city but also the three slums included in the 4km (2.5 miles) radius of that particular Cluster. This comparison can help us in designing policy that will have a constructive impact on upgrading interventions for different sectors across the city and consequently a better guide for budget allocation

The following sections elaborates on our study area, data, methodology, results and analysis.

[/vc_wp_text][/vc_column][/vc_row]

Lahore

According to Pakistan’s most recent Census (Pakistan Bureau of Statistics, 2017), 36% of Pakistan’s population lives in urban areas. The largest province in terms of population is Punjab; it accounts for 52.9% of the population. Punjab is the second most urbanized province in Pakistan where 36.71% of the population resides in cities. Punjab’s capital is Lahore that hosts nearly 15% of the province’s population, making it the most populous city of the province.

Lahore’s population is growing at 4.22% per annum and is expected to shelter 42.46 million people by 2050. The city spans 1,772 km2 (District at a Glance Lahore | Pakistan Bureau of Statistics, n.d.). Within Punjab, Lahore is the most urbanized city of the province hosting almost a third of Punjab’s urban population (State of Pakistan Cities Report 2018 | UN-Habitat). This makes Lahore our preferred area of study. Population density is estimated at around 6,300 persons per km2 and the average household size is 6.3 persons, which is quite high compared to cities of similar size Lahore Population 2021 (Demographics, Maps, Graphs). 

So how do we estimate multidimensional poverty?

In line with Alkire & Foster (2011), we estimate multidimensional poverty by combining the incidence of poverty with its intensity.  After the poverty threshold identification step, we aggregate across individuals to obtain the incidence of poverty or headcount ratio (H), which represents the proportion of poor people. We then compute the intensity of poverty (A), representing the average number of weighted deprivations experienced by the poor. Finally, we compute the adjusted poverty headcount ratio (M0) or MPI by combining H and A in a multiplicative form (MPI = H x A) (Alkire & Foster, 2011)

Dimensions of Multidimensional Poverty Index (MPI)

A key step in the development of the MPI is to decide the structure of the measure—that is, the dimensions and indicators that together measure poverty in the country.

We take three core dimensions: education, health, and living standard that sums up to a total of 15 indicators, out of which three belong to education, four to health, and eight to living standards. The indicators use a nested weight structure: equal weights across dimensions and an equal weight for each indicator within a dimension.

Table 1 provides a summary of the dimensions, indicators, thresholds and weights used in the MPI.

Dimensions Indicators Deprivation Cut-offs Weights Related SDG
Education Education Level Deprived if no member of the household has attained more than primary education 1/9 SDG 4
Literacy Deprived if no member in the household can either read or write in any language 1/9 SDG 4
Child School attendance Deprived if any school-aged child (between 6 and 11 years of age) is not attending school. 1/9 SDG 4
Health Health Facility Deprived if health facilities are not used at all, or are only used once in a while, because of access constraints (too far, too costly, unsuitable, lack of tools/staff, not enough facilities) 1/12 SDG 3
Assisted Delivery Deprived if any woman in the household has given birth, in the last 3 years, attended by untrained personnel (family member, friend, traditional birth attendant, etc.) or in an inappropriate facility (home, other). 

Households with no woman who has given birth are considered non-deprived.

1/12 SDG 3
Ante-natal Care Deprived if any woman in the household who has given birth in the last 3 years did not receive ante-natal check-ups.

Households with no woman who has given birth are considered non-deprived.

1/12 SDG 3
Immunization Deprived if any child under the age of 5 is not fully immunized according to the vaccinations calendar. Households with no children under 5 are considered non-deprived. 1/12 SDG 3
Living Standards Electricity Deprived if the household has no access to electricity 1/24 SDG 7
Cooking Fuel Deprived if the household uses solid cooking fuels for cooking (wood, dung cakes, crop residue, coal/charcoal, other) 1/24 SDG 7
Safe Water Deprived if the household has no access to an improved source of water; tap water, motor pump, mineral water hand pump, and protected well and if accessed from pipes do not follow the filtration process 1/24 SDG 6
Sanitation Deprived if the household has no access to adequate sanitation: flush system (septic tank, sewerage, and drain), privy seat 1/24 SDG 6
Ownership of Land and Livestock Deprived if the household is deprived in ownership of land and livestock 1/24 SDG 1
Small Assets Deprived if the household does not have more than two small assets (radio, bicycle, TV, iron, fan,  video cassette player, chair, watch, sewing machine, air cooler) 1/24 SDG 1
Large Assets Deprived if the household does not have any large asset (tractor, air conditioner, computer, motorcycle refrigerator) 1/24 SDG 1
Overcrowding Deprived if the household is overcrowded (4 or more people per room) 1/24 SDG 11

Table 1 Inside the MPI – Dimensions, Indicators, thresholds, weights and related SDGs

Data Sources

Pakistan Demographic and Health Surveys (DHS).

The MPI relies on different datasets that are publicly available and comparable to most developing countries. For our analysis, we have opted for the USAID-funded Demographic and Health Surveys (DHS). DHS is a major source of population and health data for the poorest countries in the world and provides high-quality and detailed data on a wide range of monitoring and impact evaluation indicators in the areas of population, health, and nutrition.

The primary sampling units in the DHS are “clusters.” Cluster size can vary but contains a number of households within a geographic area who participated in the survey. Since the data included in DHS is personal and potentially sensitive, the DHS maintains the confidentiality of the respondents by shifting the spatial coordinates of the cluster in the published data (Burgert et al., 2013).

DHS Clusters in Pakistan

The spatial coordinates for rural locations are displaced by 0–5 km in any direction. Additionally, a small fraction of coordinates, 1 percent, are randomly shifted up to 10 km. For urban locations, the displacement is up to 2 km only. DHS recommends that researchers average any environmental data over a 5–10 km buffer around each DHS rural cluster with the specific community falling somewhere within the disc around each point (Perez-Heydrich et al., 2015).

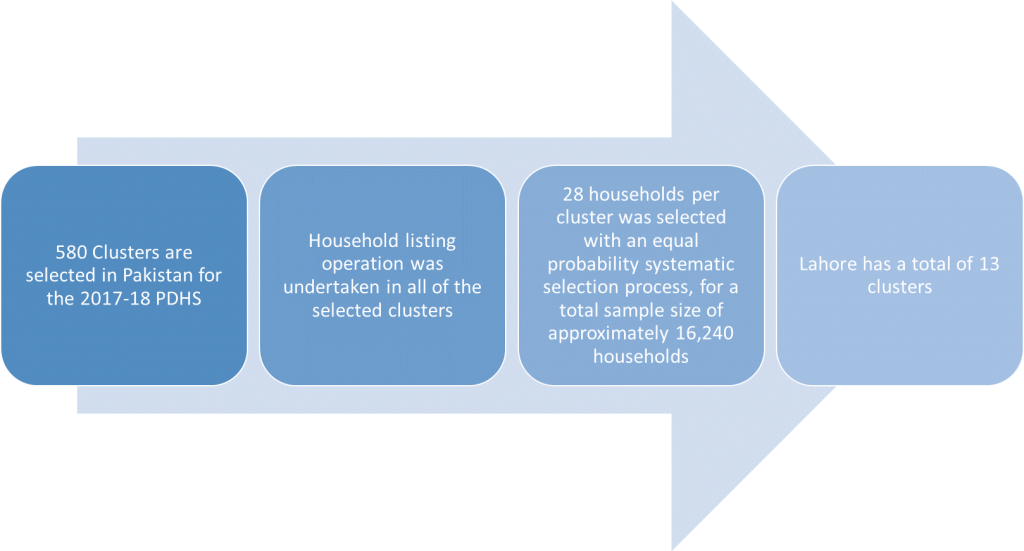
Figure 1 DHS Clusters in Pakistan from the 2017-18 PDHS (Sampling Methodology)

For this blog, we have taken Cluster-ID – HV001- 154 and have taken a 4km buffer around the center point.

Comparing Slums with DHS Cluster

Along with analyzing poverty in a DHS cluster in Lahore, we also present our findings from slums. We show the extent of deprivation in slums that are a part of the cluster which we are analyzing. Data from slums were collected in March 2019 under a study we conducted in collaboration with UNDP Pakistan and UNFPA (Aftab et al, 2019). This is primary data and we have brought it as close as possible to the DHS questionnaire.

Slums in Lahore

‘Slum’ has become a term to describe a wide range of low-income settlements and/or poor human living conditions. UN-HABITAT attempts a common definition by defining slums as households that lack one or more of the following indicators: durable housing of permanent nature, sufficient living space, easy access to safe water, access to adequate sanitation, and security of tenure (United Nations Human Settlements Programme (UN- Habitat), 2008).

According to official figures, the urban population in Pakistan is 36.4% with an estimated increase of 118 million people by 2030 (Pakistan | UN-Habitat, n.d.). If no concrete framework for action is carried out to address the problem, more than 50 per cent of the population of major cities will live in slums and become victims of these “spatial poverty traps”(Bird et al., 2002).

We have previously used remote sensing (Rehman et al., 2022) to distinguish slums from their surroundings because of the differences in spectral characteristics and as a result, help narrow areas for the socio-economic surveys to compute MPI. As a result, we have collected primary data for 35 slums in Lahore encompassing 348 households for the estimation of MPI in 2019.

The three slums encompassed in the 4km radius of the Cluster ID – HV001- 154 are L12 (Choudhary Colony), L23 (Mulhiqa Ghanakar) and L33 (Shahzad Colony) respectively. For these slums, we randomly selected 7, 3 and 11 households for our survey. Table 2 lists down the sample slums and households for this analysis.

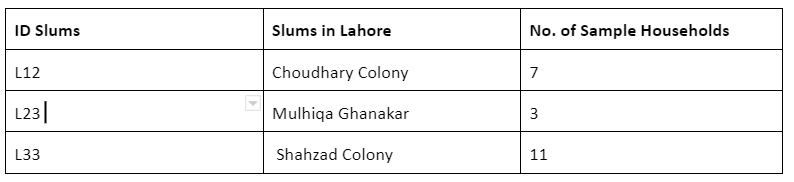
Table 2 No. of Sampled Households in Selected Slums in Lahore

Figure 2 maps the location of the DHS Cluster HV001- 154 with a 4km buffer drawn around it in Lahore, Pakistan. The locations of the three slums encompassed in the buffer are also mapped for a better visual comparison.

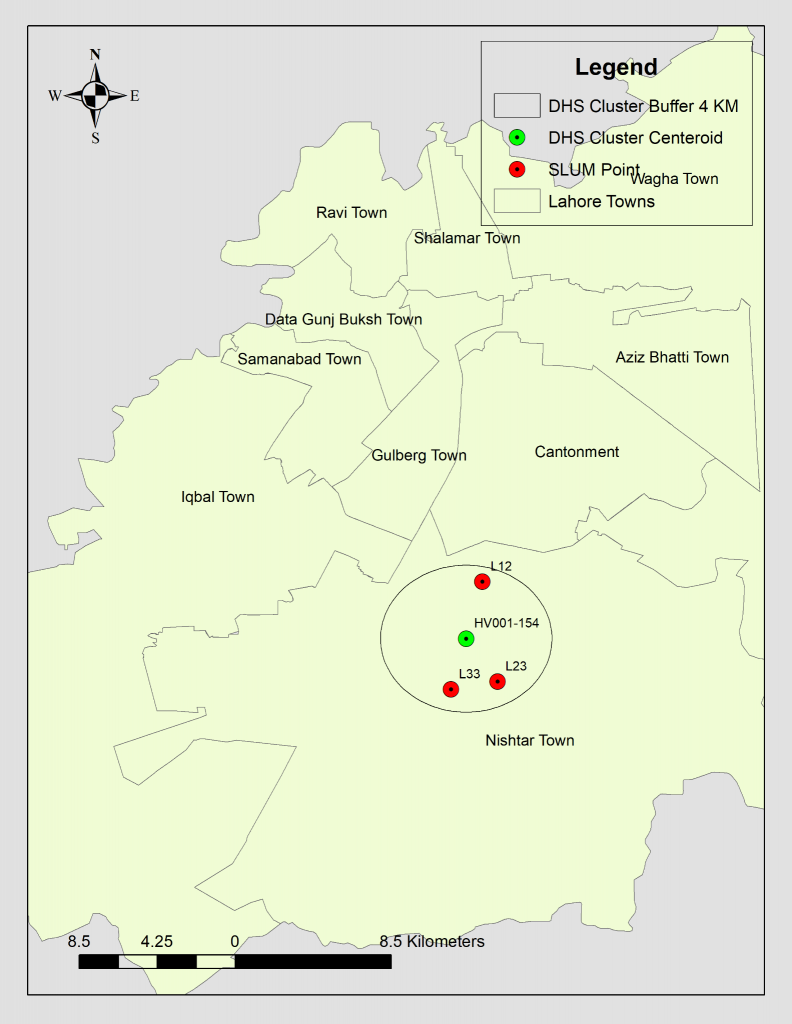
Figure 2  Multidimensional Poverty Index (MPI) Comparison between DHS and Slum Points – Lahore 2019

Analysis

In this section, we present our estimated MPI scores that reflect the proportion of weighted deprivations that the poor experience in a society out of all the total potential deprivations that the society could experience.

This means that multidimensionally poor people in HV001- 154 experience 29.9 percent of the total deprivations that would be experienced if all people were deprived in all indicators. Similarly, Slum L12, L23 and L33 are deprived in 33.7%, 27.0% and 39.0%  of the potential deprivations they can experience.

So, while the cluster cannot be classified as multidimensionally poor (remember the cutoff is 33.33%), two of the three slums are multidimensionally poor. This can be visually observed in Figure 3. The red line in the figure shows the cut-off.

The disaggregated findings are presented in Table 3 below.

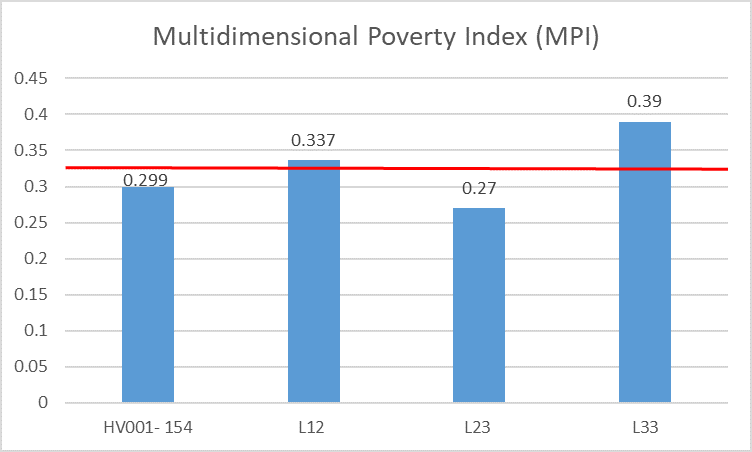
Figure 3 Multidimensional Poverty Index (MPI) of DHS Cluster (HV001-154) and Slums located inside it.

Table 3 Multidimensional Poverty Index (MPI) of DHS Cluster and Slums

For HV001- 154, the highest deprivation can be seen in the dimension of education (37.5%), followed by Living standards (34.8%) and health (27.8%).

Comparatively, for Slum L12 the highest deprivation can be seen in the dimension of education (66.5%), followed by Living standards (19.4%) and health (14.1%).

Slum L23 records the highest deprivation in the dimension of education (69.2%), followed by Living standards (20.6%) and health (10.3%).

Lastly, L33 also records the highest deprivation in the dimension of education (57.4%), followed by equal deprivation in Living standards (21.3%) and health (21.3%).

At the dimensional level, deprivations in education are the largest contributor to the MPI followed by Living standards and health for cluster HV001-154 as well as slum L12 and L23. For Slum L33, living standards and health shows equal deprivation (See Figure 4).

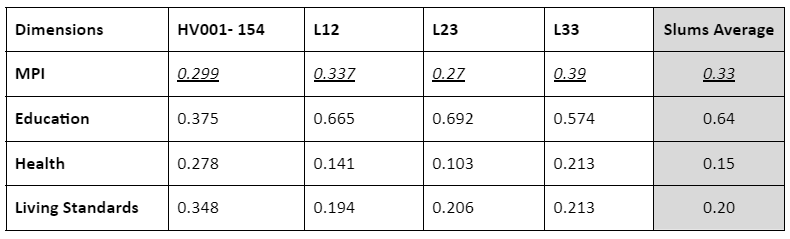
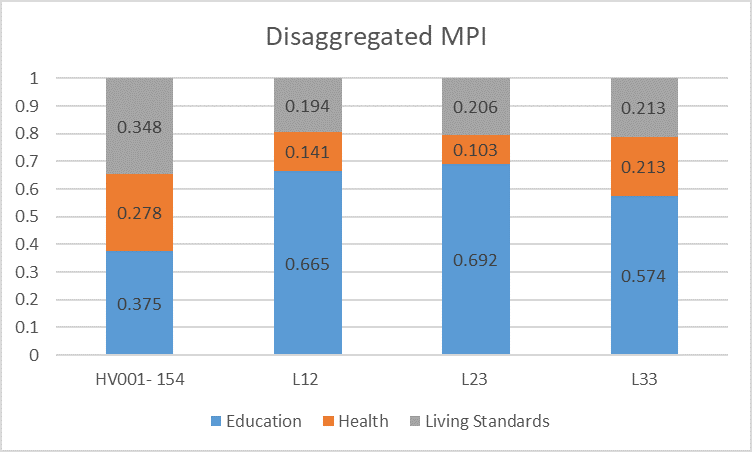
Figure 4 Disaggregated MPI.

Impact of Slums within a DHS Cluster

Figure 5 shows an in depth visualization of the DHS Cluster HV001- 154 and the three slums encompassed in a 6 km buffer drawn around it. We have additionally marked schools, hospitals, parks, places of worship and graveyards from the information made public by OpenStreetMap (OSM). OSM data is very sparse with many tags missing, so we also manually labeled more points for the required information. The green colored polygons represent the slum areas along with distance from the highway. Interestingly, this shows that the majority of the slums are located close to the main roads. The red colored regions represent the heat map of the house count in the cluster. MPI values are also mentioned for the cluster and for each slum point. This map in general shows the influence of slums within a cluster. Although it seems slums do not affect the MPI of the overall cluster because MPI is calculated on average 28 houses in a cluster, which is a very small subset of the estimated number of houses.

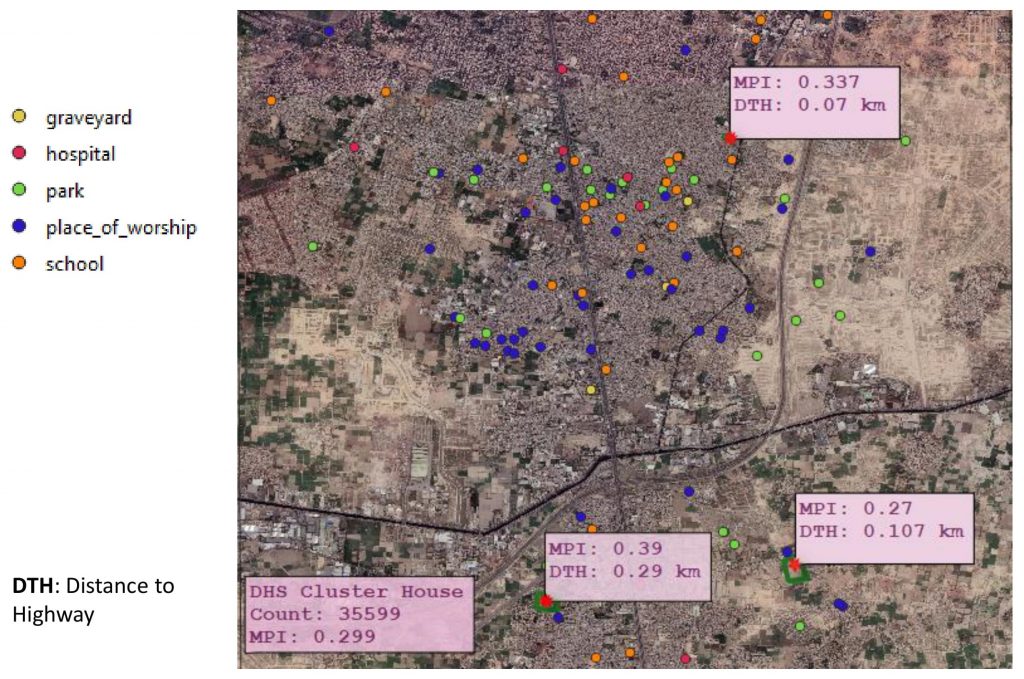
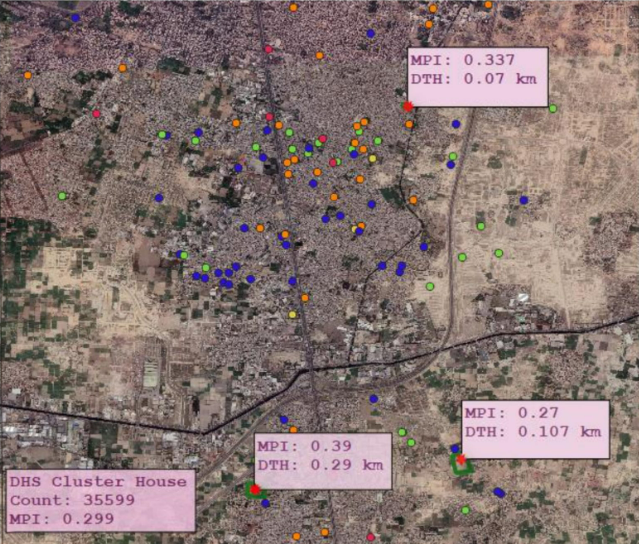
Figure 5 House Count for slums and DHS point with slums’ distance to the Highway – Lahore 201

In Figure 6 slums can clearly be seen with their boundaries drawn on map.

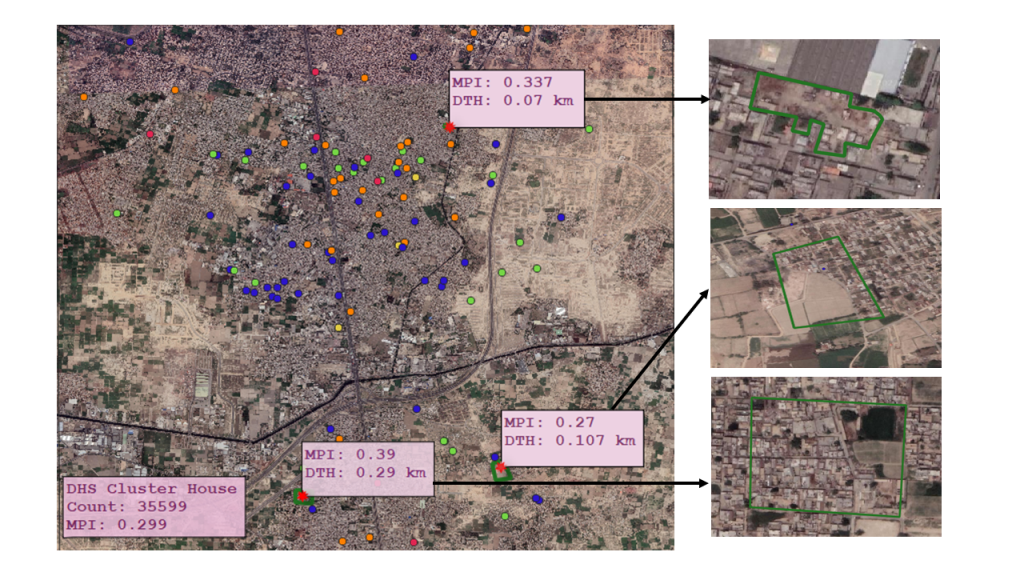
Figure 6 Zoomed version of Figure 5 to show slums with their polygons in green color – Lahore 2019

Conclusion

Our blog offers a glimpse of comparison of depriviations between slums and the DHS Cluster. Our framework can help direct which particular geographical region, and aspects of deprivation, contributes most to aggregate poverty in Lahore. Research like ours can result in more fine-grained information pinpointing deprivation at various targeted geographical locations, making it possible to design targeted solutions instead of taking a one size fits all approach.

Bibliography

  1. Aftab, I., Ali, M., Akbar,S., Islam,N., Rehman, M. F. U. (2019). Mapping  and measuring Multidimensional poverty index in Lahore, Hyderabad and Peshawar. Unpublished Manuscript
  2. Alkire, S., & Foster, J. (2011). Counting and multidimensional poverty measurement. PUBEC Journal of Public Economics, 95(7–8), 476–487.
  3. Bird, K., Hulme, D., Shepherd, A., & Moore, K. (2002). Chronic Poverty and Remote Rural Areas (SSRN Scholarly Paper ID 1754490). Social Science Research Network. https://doi.org/10.2139/ssrn.1754490
  4. Block Wise Provisional Summary Results of 6th Population & Housing Census-2017 [As on January 03, 2018] | Pakistan Bureau of Statistics. (n.d.). Retrieved October 31, 2019, from http://www.pbs.gov.pk/content/block-wise-provisional-summary-results-6th-population-housing-census-2017-january-03-2018
  5. Burgert, C. R., Colston, J., Roy, T., Zachary, B., ICF International (Firm), United States, & Agency for International Development. (2013). Geographic displacement procedure and georeferenced data release policy for the Demographic and Health Surveys.
  6. District at a glance Lahore | Pakistan Bureau of Statistics. (n.d.). Retrieved October 31, 2019, from http://www.pbs.gov.pk/content/district-glance-lahore
  7. Lahore Population 2021 (Demographics, Maps, Graphs). (n.d.). Retrieved May 29, 2021, from https://worldpopulationreview.com/world-cities/lahore-population
  8. Pakistan | UN-Habitat. (n.d.). Retrieved April 18, 2022, from https://unhabitat.org/pakistan
  9. Perez-Heydrich, C., Warren, Joshua L., Burgert, C. R., Emch, M. E., & SpringerLink (Online service). (2015). Influence of Demographic and Health Survey Point Displacements on Raster-Based Analyses. https://doi.org/10.1007/s40980-015-0013-1
  10. Rehman, M. F. U., Aftab, I., Sultani, W., & Ali, M. (2022). Mapping Temporary Slums From Satellite Imagery Using a Semi-Supervised Approach. IEEE Geoscience and Remote Sensing Letters, 19, 1–5. https://doi.org/10.1109/LGRS.2022.3180162
  11. State of Pakistan Cities report 2018 | UN-Habitat. (n.d.). Retrieved September 24, 2020, from https://unhabitat.org/state-of-pakistan-cities-report-2018
  12. United Nations Human Settlements Programme (UN- Habitat). (2008). State of the world’s cities 2010/2011: Bridging the urban divide. Earthscan